Single axis tracking simply means there is one axis of rotation. The axis can be horizontal (most common), tilted, or even vertical.
A horizontal single axis tracker is the most common configuration. The axis of rotation is horizontal, usually orientated North-South with the modules facing toward the East in the morning and the West in the afternoon. It is common for the maximum allowed angle to be 45 degrees from horizontal. Thus in the early morning and late afternoon the tracker does not move and remains at a 45° tilt angle. Some tracking systems use “backtracking” to avoid row-to-row shading. This means that in the beginning and end of the day, the tracker reverses direction.
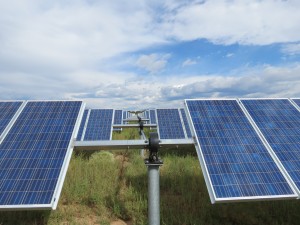
Here is a single axis tracking PV system near Santa Fe, New Mexico.
Here’s a diagram of "true-tracking" which is often used for trackers with thin-film modules. Losses from row-to-row shade ("self-shade") are approximately linear with the shaded area for thin-film modules, so it isn’t a big problem. For example, shading 10% of area is only 10% of power loss, roughly.
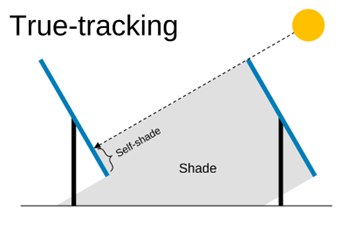
For modules with crystalline cells, power losses due to shade are typically non-linear. For example, shading 10% of area might result in something like 70% power loss. To avoid this, many single-axis trackers will use “backtracking”, where trackers follow the sun in the middle of the day but flatten out at lower solar elevation angles (morning and evening) to prevent shadows from hitting adjacent rows.
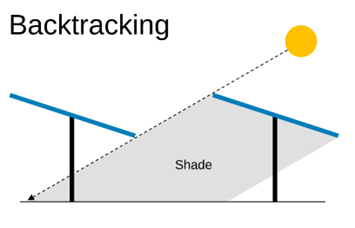
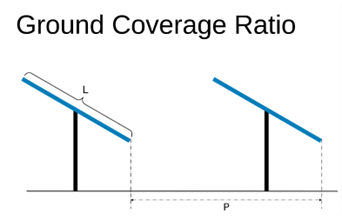
Algorithms for backtracking factor in the solar position (based on time and facility location), as well as ground coverage ratio, or GCR. GCR is generally defined as the ratio of the PV array surface area to the total facility ground area, but can be calculated as the ratio of the length of the side of the PV modules on a single row, L, to the pitch, P, which is the spacing from one row to the next measured at a common position (e.g., the center of both rows, or the leading edge of both rows, as highlighted in the figure below).
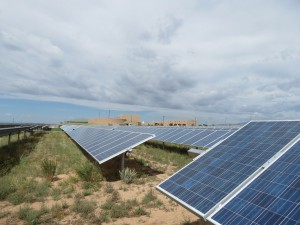
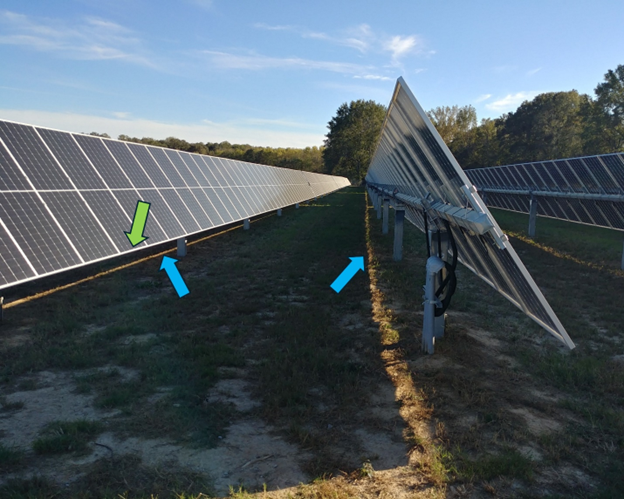
Here is a photo of a site with proper backtracking. There is no shadow on the bottom edge of the modules (green arrow) and there are only thin amounts of sunlight hitting the ground below trackers (blue arrows).
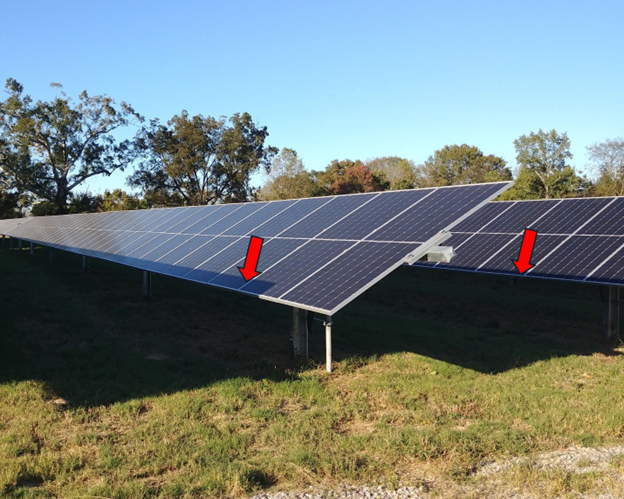
Here is an example where the backtracking is not working properly, as rows are casting shadows on each other (red arrows).
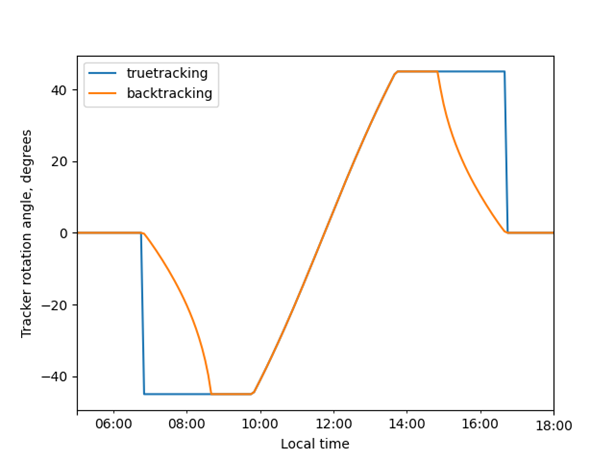
To illustrate differences in tracker rotation angles between true-tracking and backtracking, a sample chart is shown below. Each profiles represents a tracker with a maximum rotation angle of 45 degrees in each direction, which is why the lines “plateau” at -45 and +45 degrees.
Content contributed by Will Hobbs (Southern Company) and Sandia National Laboratories