Preliminary measurements were made at Sandia to demonstrate the process of measuring bifacial gains and to illustrate some of the challenges of designing bifacial experiments that are representative. In this short term test, we mounted two bifacial and two monofacial modules in two-up, landscape orientation at 35° tilt. It is worth noting that our setup was not optimized for bifacial performance. For example, the rack is supported with a 6 inch horizontal torque tube that covers a good portion of the back of the lower bifacial module and partially blocks the view to the ground behind the upper module. Also, there is a monitoring enclosure and microinverters mounted directly behind the array positioned near the middle of the two module columns.
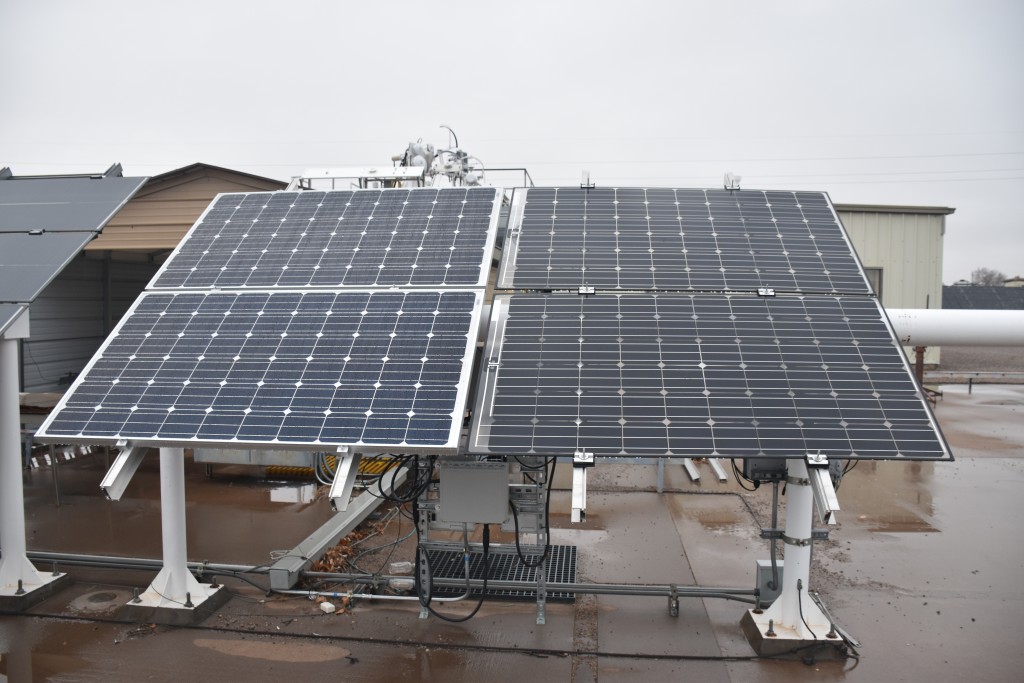
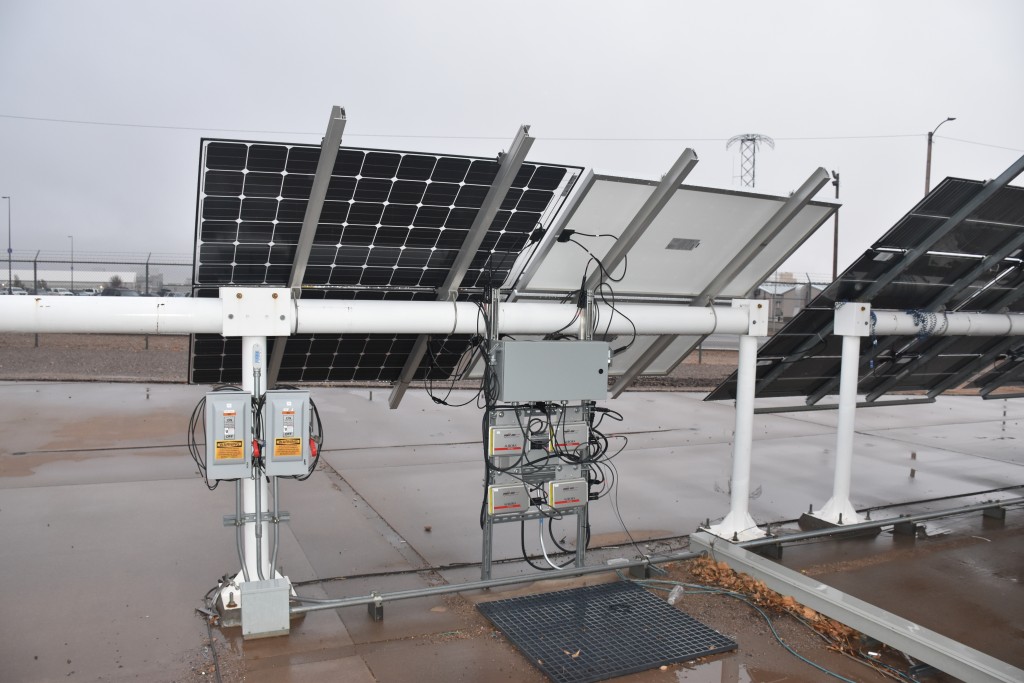
Before mounting these modules on the rack we flash tested each module at STC conditions. We flashed only the front side of bifacial modules while covering the back of the module with a black, opaque, cloth, in order to directly compare the measured power. We computed a scaling factor to adjust each module’s measured power to the same target Pmp (270W) by dividing the target Pmp by the measured Pmp at STC.
Table of flash results and scaling factors used for bifacial gain calculations
| Module | Front side Pmp (W) | Target Pmp (W) | Scaling Factor |
| Bifacial, top row | 267.8 | 270 | 1.00811 |
| Bifacial, bottom row | 269.0 | 270 | 1.003695 |
| Monofacial, top row | 259.6 | 270 | 1.055706 |
| Monofacial bottom row | 255.8 | 270 | 1.040178 |
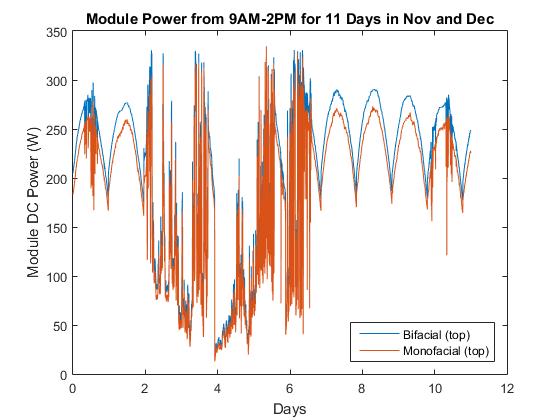
Next we mounted the modules on the rack and grid connected them using the microinverters. We independently monitored the DC current and voltage of each module and calculated DC power from the product at each minute. Before plotting the results, we multiplied each modules power by the scaling factors listed in the above table in order that any comparisons made between the modules were corrected for variability in front side STC ratings. The figures below show measured results for 1 days (Nov 23-Dec 3, 2015). The final figure compares the bifacial gains calculated every minute between the top and bottom rows of modules.

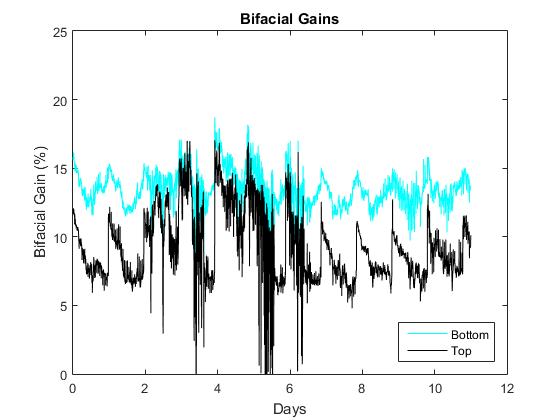
Bifacial gains for this system during the test period generally vary between about 7% and 16% and are always greater for the bottom row as compared with the top row. The extent of this difference is likely enhanced due to the low sun position during this short test (near the winter solstice). Low sun angles result in the module shadow moving further behind the array and resulting in a sunlit patch of ground directly beneath the array. Since the bottom row of modules is nearer to this bright area, they exhibit a higher bifacial gain. This difference is expected to become smaller during the summer when the sun is higher in the sky.
Bifacial gain on clear days is highest in the morning and gradually decreases throughout the day. This is most certainly due to the fact that the bifacial modules are on the East side of the rack. Therefore in the morning, the sunlight coming from an angle hits the ground directly under the bifacial modules while the shadow is projected to the West under the monofacial modules. In the afternoon, the shadow from the modules is projected under the bifacial side of the array and thus reduces the bifacial gain.