pvlib-python
Originally developed at Sandia National Laboratories, this open-source PV performance modeling library is the gold-standard source for published models and algorithms. It is currently maintained by a diverse team of PV system experts. Source code is available on GitHub. Please see the Installation page for installation help. For examples of how to use pvlib python, please see Package Overview. The documentation assumes general familiarity with Python, NumPy, and Pandas. Google searches will yield many excellent tutorials for these packages.
PVAnalytics
PVAnalytics is a python library that supports analytics for PV systems. It provides functions for quality control, filtering, and feature labeling and other tools supporting the analysis of PV system-level data. It can be used as a standalone analysis package and as a data cleaning “front end” for other PV analysis packages.
PVAnalytics is free and open source under a permissive license. The source code for PVAnalytics is hosted on github.
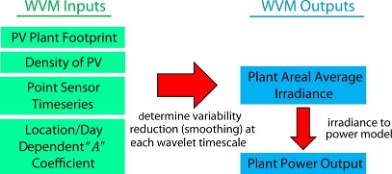
Wavelet Variability Model
The WVM models the average irradiance over a PV plant footprint. It does this by smoothing the measurements from an irradiance points sensor by different amounts at different timescales. The WVM smoothed irradiance can be used with irradiance to power translation methods to create simulated PV plant power output. To run the WVM, you need measurements from an irradiance point sensor, some information about the PV plant you’d like to simulate (see code syntax section and examples section below), and the cloud speed. The model is described in the following paper: Lave, M.; Kleissl, J.; Stein, J.S., “A Wavelet-Based Variability Model (WVM) for Solar PV Power Plants,” Sustainable Energy, IEEE Transactions on , vol.4, no.2, pp.501,509, April 2013, doi: 10.1109/TSTE.2012.2205716.
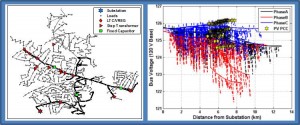
GridPV Toolbox
The GridPV Toolbox simulates the integration of distributed generation into the electric power system to determine the impacts on the distribution system of highly variable generation. MATLAB provides the frontend user interface through a COM interface to control OpenDSS. OpenDSS is command based and has limited visualization capabilities. By bringing control of OpenDSS to MATLAB, the functionality of OpenDSS is utilized while adding the looping, advanced analysis, and visualization abilities of MATLAB. The GridPV Toolbox provides Matlab files categorized into five main sections in the manual: OpenDSS functions, Solar Modeling functions, Plotting functions, Geographic Mapping functions, and Example Simulations
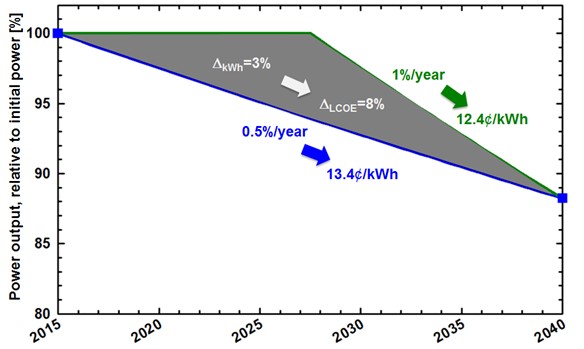
PV Degradation Example Scripts
These Jupyter notebooks demonstrate how to estimate PV performance degradation rates using different methods including: (1) linear regression with ordinary least-squares, (2) classical seasonal decomposition, (3) seasonal and trend decomposition using locally weighted scatterplot smoothing, (4) Holt-Winters triple-exponential shooting, (5) autoregressive integrated moving average, and (6) robust principle component analysis.
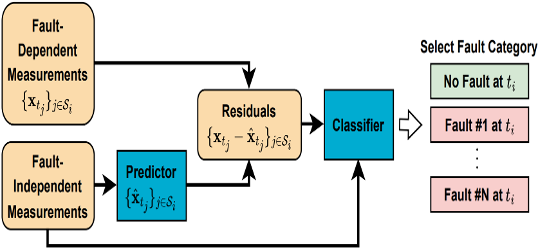
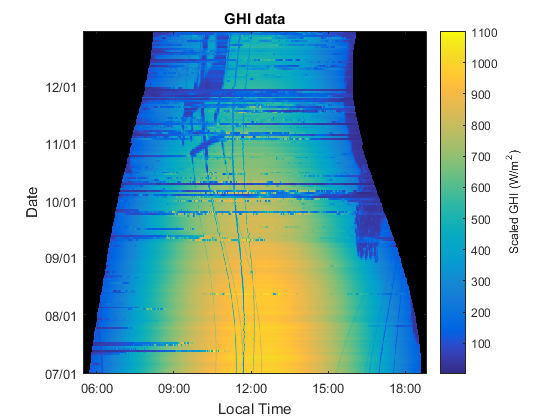
Algorithms Classifying PV Single Axis Tracker Faults
This is a comparison of three single axis tracker (SAT) fault detection and classification algorithms: large SAT tilt error detection, power loss detection using convolutional neural networks, and multiple time series classification using XGBoost decision trees. A description of each algorithm and a detailed analysis of the comparison results are given in Machine learning for photovoltaic single axis tracker fault detection and classification. The comparison is performed using time series data collected from a SAT PV system in Albuquerque, New Mexico, USA. The dataset and comparison code are available on DuraMAT Data Hub.