Introduction
Sandia National Laboratories is organizing the 2023 blind PVPMC modeling intercomparison to provide an opportunity for PV modelers to test their models and modeling ability against real system data and also help to provide a baseline quantifying how much variability there is between different models and modelers. Measured weather and irradiance data are provided along with detailed descriptions of PV systems from two locations (Germany [exact location will not be disclosed] and Albuquerque, New Mexico USA). Participants are asked to simulate the plane-of-array irradiance, module temperature, and DC and AC power outputs from these four systems (scenarios) and submit their results back to Sandia for processing.
Sandia plans to present an anonymized summary of the results at the next PVPMC workshops planned for November 8-9, 2023 in Mendrisio, Switzerland and May, 2024 in Salt Lake City, UT. Upon completion, Sandia would like to prepare a journal article describing the study with all the participants included as co-authors. The authors list will be listed in the order of 1) leading writer(s) and/or organizer(s), 2) execution of most scenarios, 3) contribution to the paper writing, 4) availability of data, 5) provision of feedback. If any of the participants do not wish to have their name included in any publication, please inform mtheris@sandia.gov.
In this intercomparison, two groups will be invited as follows:
- Open invitation for anyone to participate: same process as in the 2021 intercomparison through PVPMC’s email list.
- Software products by invitation only. Invitation emails were sent out on October 11. If your software entity did not receive an invitation, please reach out, we would love to have you on board.
The analysis of Phase 1 and 2 (see Figure 1 for more details) for both groups will be summarized in a manuscript with best practices in PV performance modeling.
Objectives
The objectives of this blind intercomparison are to:
- quantify differences among modelers
- investigate whether some models are more accurate than others
- see if performance modeling can be improved
- quantify validity of PV performance models
- find sources of uncertainty
- develop workplan to improve functionality and reproducibility
Scenarios
Based on the findings, lessons learned, and feedback received from the previous blind modeling intercomparison, four scenarios were identified as shown in Figure 1:
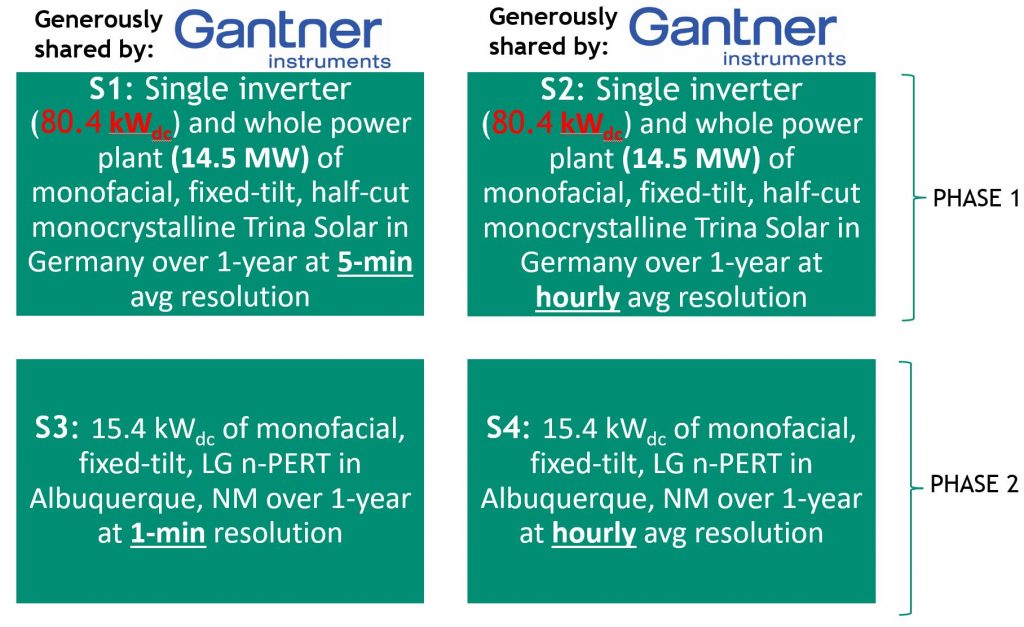
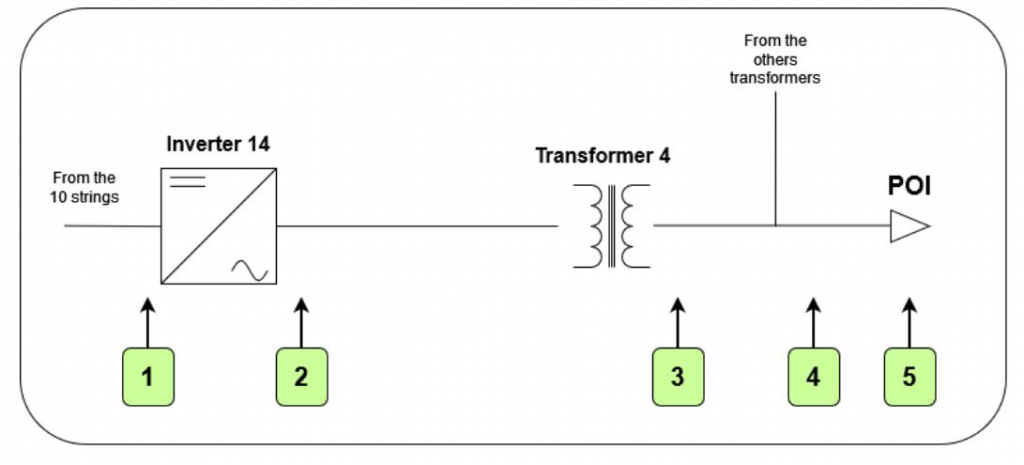
Please note that this figure was modified on July 21st, 2023 to account for the correct number of strings on Inverter 14 (10 strings – 80.4 kWdc, not 9 strings).
The scenarios are based on two systems: one in Germany and one in Albuquerque, NM. S1 and S2 are on 5-min and hourly average resolution, respectively. S3 and S4 are on 1-min and hourly average resolution, respectively. While S3 and S4 will only involve DC power only, S1 and S2 will include DC and AC power on the inverter- (1 out of 200 inverters in the plant) and site-level (all 14.5 MW).
**Additional details about the module and system specifications are included in the INSTRUCTIONS_PVPMC_modeling_comparison.pdf file.
Reporting Results
The four modeling scenarios are described in the following section. To participate one must “copy and paste” their estimates (i.e., POA irradiance [when applicable], module temperature, DC and AC power on inverter_14- and site-level [when applicable]) into the corresponding tabs (S1 – S2 , or S3 – S4) of the PhaseX_Results.xlsx file (the link is below). Running all scenarios is optional, but strongly encouraged. In addition to the estimated timeseries, the participants are requested to provide answers with respect to the model/software they used and inputs/assumptions according to the questionnaires at each excel tab.
The Due Date for the submissions varies according to the diagram in Figure 2. Please send the completed PhaseX_Results.xlsx file to Dr. Marios Theristis at mtheris@sandia.gov before the deadlines. If you have any questions after reading all of the documentation please email Marios and he will update the FAQ section of at the end of the page, as appropriate so everyone can see the same answers.
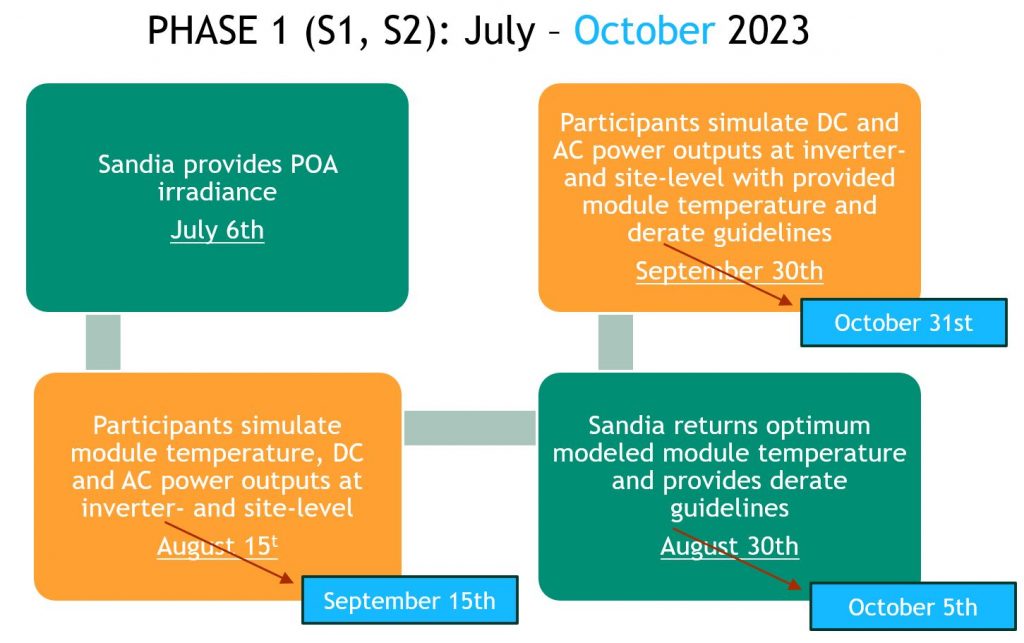
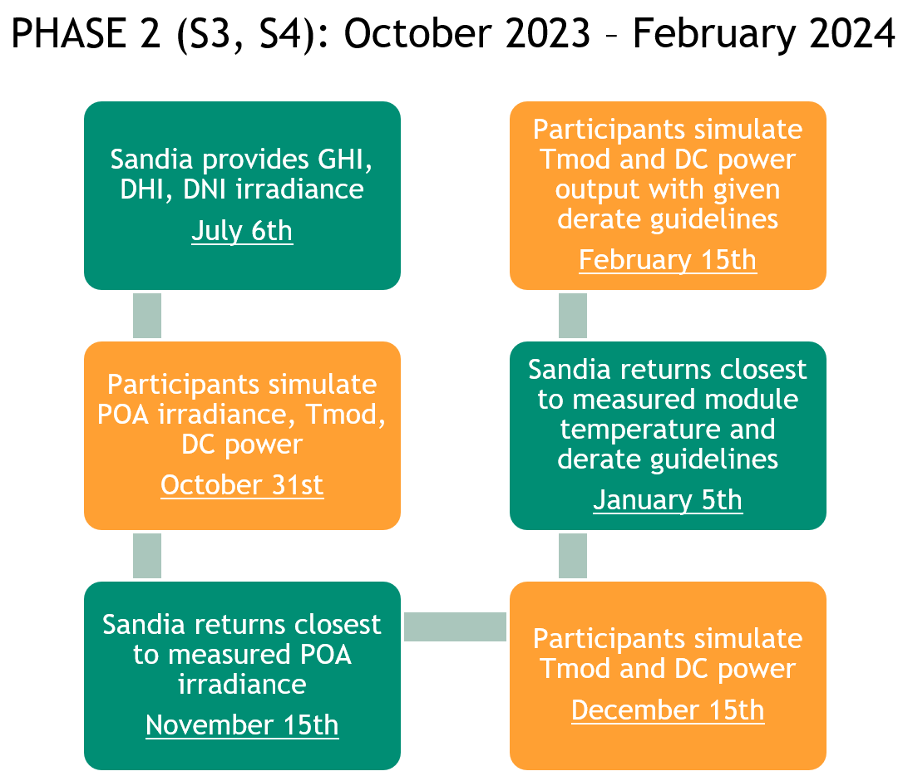
Figure 2: The iterative process of 2023 blind PVPMC PV modeling intercomparison will enable error propagation at each modeling step and a self-learning experience for all participants. Phase 1 will run from July – October 2023 whereas Phase 2 will run from October 2023 – February 2024. The timeline of this process is also shown underlined. (Higher resolution version of this figure is available in the instructions file)
Files
- Detailed Information and Instructions
- 2023 Blind Modeling Comparison Instructions (Aug 10 Update) (103159 downloads )
- This document was last updated on August 10th. If your simulations were based on the power plant configuration in previous versions, please update your models according to the new table. For this reason, all deadlines were extended. We apologize for the inconvenience.
- Weather Data
- Phase 1
- Module Specifications and test reports
- Phase 1 (S1 & S2):
- Phase 2 (S3 & S4):
- Inverter & Transformer Spec Sheets
- Phase 1 (S1 & S2)
- Phase 2 (S3 & S4):
- Files to paste in your modeling results
- Phase 1 (S1 & S2)
- Phase 2 (S3 & S4)
FAQs
Please send your questions to Marios Theristis (mtheris@sandia.gov). We will post relevant questions and answers below for everyone’s information.
1) You are asking for hourly and sub-hourly results for the same periods. I would expect anyone who has sub-hourly simulation capability to summarize their sub-hourly results to produce the hourly values. Am I misunderstanding something?
– We would expect the results to be different. Whenever a participant submits both sub-hourly and hourly we will ask them to clarify whether they averaged the estimates or if they re-ran the simulation with the hourly averaged inputs.
2) Will the measured PV power be available for researchers in the future for model evaluation?
– The commercial data (S1, S2) will probably not be made available. Data from the other scenarios will be made available in the future.
3) Since inverter 14 has 10 strings, should the schematic in Fig. 1 not be 80.4 kWp instead of 72.36 kWp?
– Yes, we corrected the typo on the schematic on the website and also the instructions file vJuly2123.
4) Could you provide an indication of how far off the latitude and longitude of the German location are? Alternatively, can you provide the sun positions?
– The power plant in Germany is within a 10 km radius from the provided coordinates.
5) For S1: Phase1_meteo_5min.xlsx weather data, do the timestamps represent beginning of averaging intervals? For example, does the first row of data represent the average from 12:00 to 12:05, and the second row represents 12:05 to 12:10, etc.?
– Yes, the timestamps represent the beginning of averaging intervals: e.g., 12.05 is from 12.05 to 12.09.
6) Were there any system outages?
– Such events, if any, will be filtered out from the analysis.
7) Were there any periods where system output was curtailed?
– Such events, if any, will be filtered out from the analysis.
8) Did the system ever operate at a power factor other than the default?
– The inverter has been always operating at power factors > 0.90 at dc power outputs > 1 kW. Mean and median power factor values were 0.998, when producing > 50% of the inverter capacity.
9) What maintenance was done before and during 2022, if any?
– No incidents requiring maintenance were reported at this site.
10) Is there a grid interconnection limitation we should take into account when modeling this system in Germany for Phase I?
– There is no grid interconnection limitation.
11) Could you provide details about module strings layout connected to inverter 14, so that I can estimate the wire length per string
– There are 10 strings with 24 modules per string. More information are given in the single line diagram in the instructions file.
12) The commission date is in which month in 2020, Jan was different from Dec while considering power degradation.
– The power plant was commissioned in the first quarter of 2020.
13) Do you have rainfall data for these two sites, did they ever wash modules during 2022?
– No rainfall data are available. The location observes very low soiling rates.
14) You are asking for results from Inverter 14 of Transformer 4. Can I just model the whole plant and divide by 200?
– No, Please look at the power plant configuration in the instructions file.
15) Will PAN and OND files be provided for Phase 1?
– PAN files will be returned to participants that used software requiring such files in order to examine what assumptions are typically being made when such files are unavailable. We do not have an OND file available.
16) Were the sensors or modules ever cleaned?
– This location observes low soiling and therefore, no cleaning was required for this period.
17) Are the inverters programmed to limit at 60kW, 66kW or some other value?
– The inverters clip at 60 kW.
18) What is the height at which the wind speed measurements were taken?
– 2 meters above the array height.
19) Is the POA irradiance measured by a pyranometer or a reference cell?
– The POA irradiance was measured with a pyranometer.
20) Can I use model/software X for S1 and model/software Y for S2?
– Yes you can. You can also participate with 2 submissions.
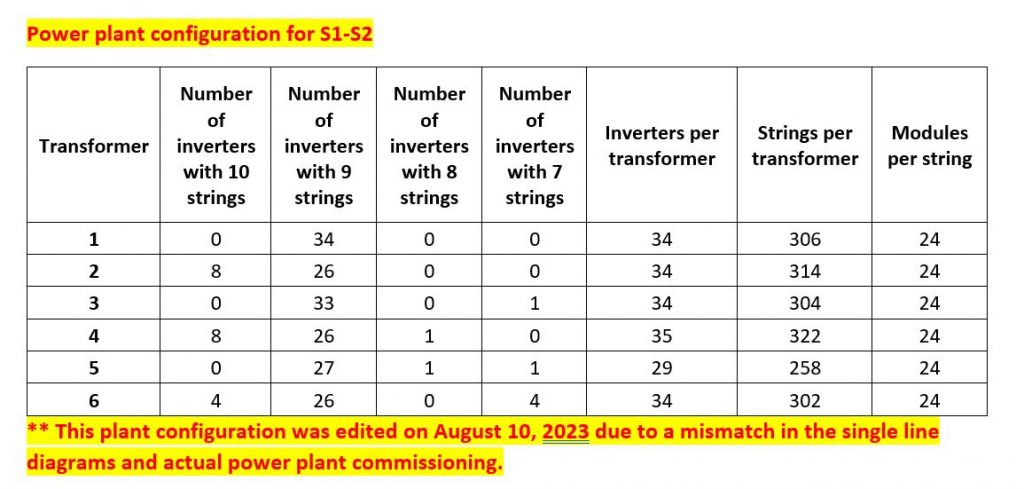
21) Are there 1804 or 1806 strings? The instruction file metadata mention 1806 strings, but the configuration table adds up to 1804 strings. What is the correct number of strings?
– It seems that there was a mismatch between the single line diagrams and the actual power plant configuration. For this reason, we have updated the instructions file and corresponding table to reflect the actual power plant configuration. If you submitted your results based on the older table, please update your results based on the correct configuration (see table below) and re-submit:
22) At which points in the power plant are you asking for the DC and AC powers?
– We are asking for the dc and ac power before (point 1) and after (point 2) Inverter 14 of Transformer 4. We are also asking for the dc power (sum of all 1s) of all 200 inverters (i.e., the site) and the ac power (sum of all 2s) of all 200 inverters (i.e., the site).
23) Could you please provide input files with complete and continuous original measurements? A column of flags indicating the results of the QC would be much more useful than having questionable values set to zero. It would also be helpful to provide a flag that indicates which records will be excluded for sure from the evaluation (on the understanding that further records might be excluded based your later analysis).
– Unfortunately we are not able to share any original measurements. The records that are set to zero will be excluded from the evaluation. The filtering criteria are listed in the instructions file, but for the Phase 1 data we will not be able to provide a QC column. We can do that for Phase 2 only once the analysis is completed.