The PV industry lacks clear and consistent understanding of PV operations software, and many stakeholders are not fully aware of the importance of these tools for improving operational performance. This makes it difficult to assess capabilities, compare approaches, and make informed decisions.
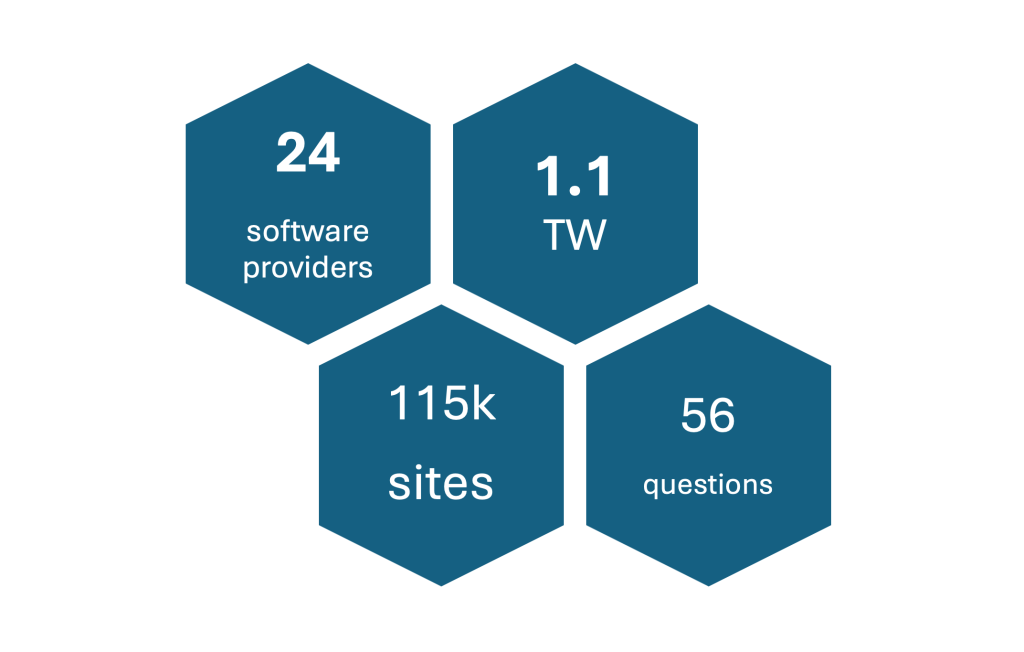
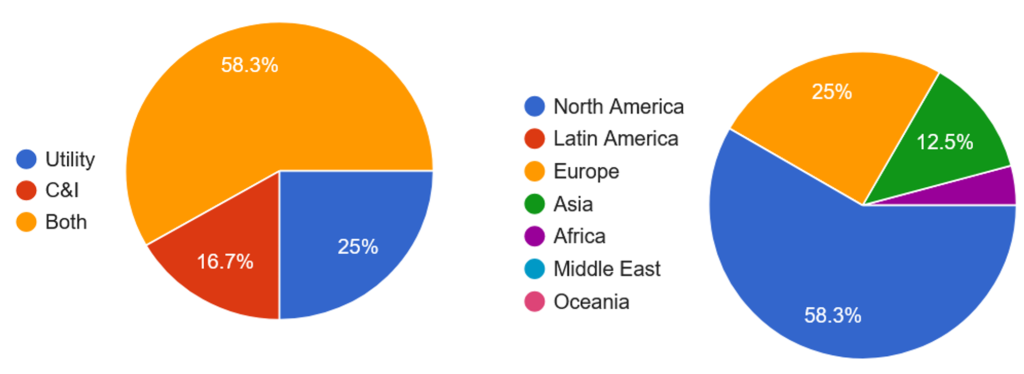
PVMAC conducted the first structured, industry-wide questionnaire of software providers to assess capabilities, integration practices, and operational functionality. The aggregated findings presented here assess industry maturity, highlight strengths and gaps, and identify areas for improvement. Rather than serving as a vendor catalogue, the report focuses on cross-cutting trends, with raw responses published separately for transparency.
The table below summarizes the key findings and takeaways.
| Section | Summary | Takeaway |
| Onboarding | First-site deployment often <1 week; additional sites integrate in hours if SCADA/metadata are consistent. Automation limited (~50% semi-automated, ~8% fully automated). | Data ingestion and harmonization are key bottlenecks; scalable analytics require upstream consistency. |
| Interoperability and integration | APIs widely available (~70%), but documentation varies; ~30% restricted. Integration with CMMS, ERP, PV design software, forecasting, market data are common but often bilateral. | Technically connected but not standardized; inconsistent integrations limit automation and scalability. |
| Data quality | All platforms perform QC (range checks, cross-sensor validation, statistical filtering). Missing/erroneous data handled via filtering (~75%) and/or imputation (~67%). Transparency varies. | QC methods differ, affecting KPIs and expected yield; shared frameworks would improve consistency and trust. |
| Imaging analytics | ~40% support RGB imagery with geolocated faults overlay on digitized plant layouts; IR, satellite, EL/PL, LiDAR less common. | Imaging is more periodic than continuous; insights depend on geospatial data rather than operational data. |
| Digital twin | ~75% report DT capability: physics-based (~38%), field performance (~20%), AI-based (~14%), geospatial (~28%). Mainly for expected yield (~60%), less often predictive or command/control (~30-35%). | Needs clearer, standardized definitions to distinguish simulation, operational (push and receive), or predictive twins. |
| Expected yield | ~83% calculate expected energy (physics-based, proforma, ML, hybrid). Adjustments for weather, curtailment, clipping, degradation vary. Transparency partial (~80%). | Inconsistent assumptions cause variability in reported plant performance; core source of analytics opacity. |
| KPIs | All platforms report KPIs. Definitions, normalization, and handling of missing data vary. | Lack of standardized KPI framework limits comparability and reproducibility. |
| Use of AI/ML and diagnostics | ~85% use AI/ML; primarily for diagnostics, predictive maintenance, performance prediction. Additional use in data quality, imagery analysis, LLM interfaces. Strong fault detection; work order linkage ~80%. | Predictive analytics feasible only on serviceable components; methodological clarity is needed. |
| Transparency and documentation | Documentation access: ~45% user-accessible, ~17% public, ~25% NDA, ~10% unavailable. Reproducibility claims ~50%. | Transparency improving, but still the weakest link. Documentation and robust validation make software outcomes “auditable” and increase confidence for asset owners. |
| Business models and support | Pricing: MW-based subscriptions, enterprise agreements, pay-per-use. ~60% undisclosed. Support widely offered: tutorials, live sessions, certifications. | Pricing opacity limits independent evaluation; technical support generally strong. |
Downloads
- PV Operations Software Transparency: A PVMAC Industry Snapshot (655 downloads )
- Raw Responses from PV Operations Software Transparency: A PVMAC Industry Snapshot (476 downloads )
Contact
- Marios Theristis (mtheris@sandia.gov)
Many thanks to all participating software providers for contributing their time and insights and helping move the industry forward: