More than 81% of the annual capacity of utility-scale photovoltaic (PV) power plants in the U.S. use single-axis trackers (SATs), and in 2022, delivered an average capacity factor 4% higher than that of fixed-tilt systems [1]. However, with additional software configuration and moving parts, SATs are naturally more prone to failure. If SAT faults are left undetected, the overall power yield of the PV power plant is reduced significantly. This work proposed a machine learning framework for SAT fault detection and classification algorithms, and implemented the proposed framework to detect two kinds of SAT faults — stall faults where the SAT cannot move, and timing mismatch faults where the SAT’s internal clock is misconfigured. The implementation was compared against two SAT fault detection algorithms — large SAT tilt error detection described in [2], and power loss detection using convolutional neural networks described in [3]. The comparison was performed using time series data collected from a SAT PV system in Albuquerque, New Mexico, USA, where the two kinds of SAT faults were emulated. The comparison found that the implementation of the proposed framework reliably detected these emulated SAT faults relative to other algorithms, and produced nearly zero false alarms. A description of each algorithm and a detailed analysis of the comparison results are given in [4].
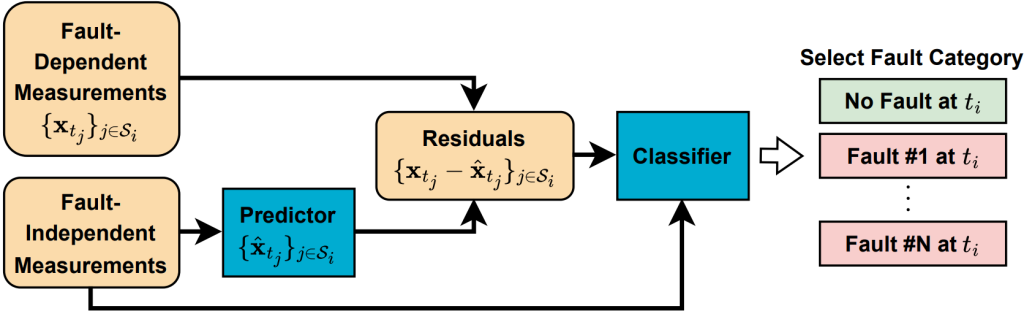
Flowchart of the proposed SAT fault detection and classification framework. A predictor model uses the fault-independent time series to predict the values of the fault-dependent time series. A classifier model analyzes the residuals between the actual and predicted measurements and outputs a fault category. Fault categories represent SAT faults with similar observable effects. A fault is detected at time ti when any fault category other than “No fault at time ti” is outputted. The index set Si ⊂ {0, 1, 2, …, i} encodes what time series measurements are available for processing to classify the SAT’s state at time ti.
Jupyter notebook guide to reproduce the comparison results
A Jupyter notebook guide to replicate the comparison results of the three SAT fault detection and classification algorithms is provided in the guide directory of source_code_and_models.zip on DuraMAT Data Hub. The zip archive is organized as a Python package with a README.rst file containing installation instructions and links to download the time series data.
Time series data
The time series dataset for the comparison was collected from a SAT PV system in Albuquerque, New Mexico, USA, from 2023-06-13 to 2023-11-25. The system had two strings with six Canadian Solar CS3U-355PB-AG modules each, all mounted on the same SAT. The SAT was an Array Technologies model that determines the appropriate tilt angle using an internal clock and a closed-loop irradiance feedback control. Its tilt ranged from about 44.35 degrees East to about 38.69 degrees West. The dataset is available on DuraMAT Data Hub.
References
| [1] | Bolinger, J. Seel, J. M. Kemp, C. Warner, A. Katta, and D. Robson, “Utility-Scale Solar, 2023 Edition: Empirical Trends in Deployment, Technology, Cost, Performance, PPA Pricing, and Value in the United States,” Lawrence Berkeley National Laboratory, Oct. 2023, p. 65. |
| [2] | Anderson, C. Downs, S. Aneja, and M. Muller, “A Method for Estimating Time-Series PV Production Loss From Solar Tracking Failures,” IEEE Journal of Photovoltaics, vol. 12, no. 1, pp. 119–126, Jan. 2022, ISSN: 2156-3381, 2156-3403. DOI: 10.1109/JPHOTOV. 2021.3123872. |
| [3] | Zgraggen, Y. Guo, A. Notaristefano, and L. Goren Huber, “Physics Informed Deep Learning for Tracker Fault Detection in Photovoltaic Power Plants,” Annual Conference of the PHM Society, vol. 14, no. 1, Oct. 28, 2022, ISSN: 2325-0178, 2325-0178. DOI: 10 . 36001 / phmconf.2022.v14i1.3235. |
| [4] | Transue, M. Theristis, and D. M. Riley, “Machine learning for photovoltaic single axis tracker fault detection and classification,” Energy and AI, p. 100652, Nov. 2025, doi: 10.1016/j.egyai.2025.100652. |