Introduction
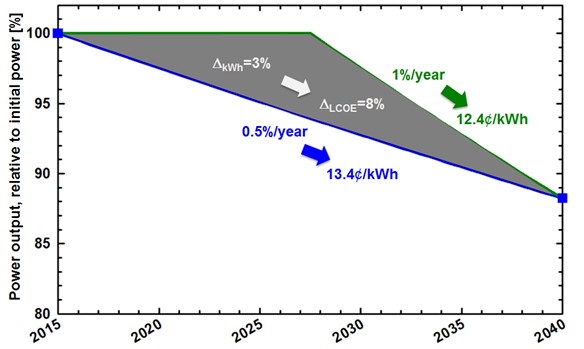
Started in 2016, the PV Lifetime Project is measuring PV module and system degradation profiles over time with the aim of distinguishing different module types and technology. Outdoor energy monitoring in different climates will be supplemented with regular testing under repeatable test conditions indoors. The focus will be on the PV module, as well as other hardware components (junction boxes, bypass diodes, and module-level electronics) attached to it. Hardware will be installed at Sandia National Laboratories in New Mexico, at the National Renewable Energy Laboratory in Colorado, and at the University of Central Florida. The systems will be continuously monitored for DC current and voltage, as well as periodic I-V curves at the string level. In the future, once degradation trends have been identified with more certainty, results will be made available to the public online. This data is expected to enable an increase in the accuracy and precision of degradation profiles used in yield assessments that support investments made in new PV plants.

1 Jordan, D. C., Kurtz, S. R., VanSant, K., and Newmiller, J. (2016) Compendium of photovoltaic degradation rates. Prog. Photovolt: Res. Appl., 24: 978–989. doi: 10.1002/pip.2744.
More Information
Nov. 29, 2016: Check out the news story about the project and installations in Colorado.
Publications
- Theristis, M., J. S. Stein, C. Deline, D. Jordan, C. Robinson, W. Sekulic, A. Anderberg, D. J. Colvin, J. Walters, H. Seigneur and B. H. King (2022). “Onymous early-life performance degradation analysis of recent photovoltaic module technologies.” Progress in Photovoltaics.
- Repins, I. L., D. Jordan, M. Woodhouse, M. Theristis, J. S. Stein, H. Seigneur, D. Colvin, J. F. Karas, A. N. McPherson and C. Deline (2022). “Long-Term Impact of Light and Elevated Temperature Induced Degradation on Photovoltaic Arrays.” MRS Bulletin 48.
- Driesse, A., M. Theristis and J. S. Stein (2021). “A New Photovoltaic Module Efficiency Model for Energy Prediction and Rating.” IEEE Journal of Photovoltaics 11(2): 527-534.
- Micheli, L., M. Theristis, A. Livera, J. S. Stein, G. E. Georghiou, M. Muller, F. Almonacid and E. F. Fernández (2021). “Improved PV Soiling Extraction Through the Detection of Cleanings and Change Points.” IEEE Journal of Photovoltaics 11(2): 519-526.
- M. Theristis, A. Livera, C. B. Jones, G. Makrides, G. E. Georghiou and J. S. Stein, “Nonlinear Photovoltaic Degradation Rates: Modeling and Comparison Against Conventional Methods,” in IEEE Journal of Photovoltaics, doi: 10.1109/JPHOTOV.2020.2992432.
- Driesse and Stein (2020) From IEC 61853 power measurements to PV system simulations (4118 downloads ) , SAND2020-3877
- Livera et al. (2020) Guidelines for ensuring data quality for photovoltaic system performance assessment and monitoring (3955 downloads )
- Stein and Jordan (2018) Glass-Glass Photovoltaic Modules – Overview of Issues (7635 downloads ) , Fall DuraMAT Workshop, Stanford, CA
- Stein et al. (2018) PV Lifetime Project: Measuring PV Module Performance Degradation: 2018 Indoor Flash Testing Results (6287 downloads ) , WCPEC-7, Waikoloa, HI.
- Stein et al. (2018) PV Lifetime Project –Challenges of Measuring PV Module Degradation (4445 downloads ) , 2018 PV Module Reliability Workshop, Denver, CO
- Stein, J.S. (2017) Challenges of PV Degradation Analysis: PVLIB and Performance Data Analysis (4383 downloads ) , Fall DuraMAT Workshop, Albuquerque, NM
- Hansen and Jordan, (2017) Sample size guidelines for PV lifetime project (4844 downloads ) , SAND2017-483R.
For more information about the PV Lifetime Project please contact the Task Lead for this project, Marios Theristis (mtheris@sandia.gov)
