2023 Update
This work is now published in Progress in Photovoltaics!
Theristis, M., N. Riedel-Lyngskær, J. S. Stein, L. Deville, L. Micheli, A. Driesse, W. B. Hobbs, S. Ovaitt, R. Daxini, D. Barrie, M. Campanelli, H. Hodges, J. R. Ledesma, I. Lokhat, B. McCormick, B. Meng, B. Miller, R. Motta, E. Noirault, M. Parker, J. Polo, D. Powell, R. Moretón, M. Prilliman, S. Ransome, M. Schneider, B. Schnierer, B. Tian, F. Warner, R. Williams, B. Wittmer and C. Zhao (2023). “Blind photovoltaic modeling intercomparison: A multidimensional data analysis and lessons learned.” Progress in Photovoltaics https://doi.org/10.1002/pip.3729.
Introduction
Sandia National Laboratories is organizing this PV performance modeling comparison to provide an opportunity for PV modelers to test their models and modeling ability against real system data and also help to provide a baseline quantifying how much variability there is between different models and modelers. Measured weather and irradiance data are provided along with detailed descriptions of PV systems from two locations (Albuquerque, New Mexico USA and Roskilde, Denmark). Participants are asked to simulate the plane-of-array irradiance, module temperature, and DC power output from these six systems (scenarios) and submit their results back to Sandia for processing.
Sandia plans to present an anonymized summary of the results at the next PVPMC workshop planned for October 19-20, 2021 in Salt Lake City. Following this workshop, Sandia would like to prepare a journal article describing the study with all of the participants included as co-authors. The authors list will be listed in the order of 1) leading writer(s) and/or organizer(s), 2) execution of most scenarios, 3) contribution to the paper writing, 4) availability of data, 5) provision of feedback. If any of the participants do not wish to have their name included in any publication, please inform Dr. Marios Theristis mtheris@sandia.gov.
The Due Date for all modeling submissions is Friday, September 10, 2021. Please send the completed Results.xlsx file to mtheris@sandia.gov before the deadline. If you have any questions after reading all of the documentation please email Marios and he will update the FAQ section of this webpage, as appropriate so everyone can see the same answers.
Objectives
The objectives of this blind intercomparison are to:
- quantify differences among modelers
- investigate whether some models are more accurate than others
- see if performance modeling can be improved
- quantify validity of PV performance models
- find sources of uncertainty
- develop workplan to improve functionality and reproducibility
Scenarios
Six scenarios of practical interest to the community were identified to include a) fixed and tracking systems, b) monofacial and bifacial modules, c) modules beyond the traditional aluminum back surface contact (Al-BSF) technology, d) distinctively different geographical locations/climates. The six scenarios include:
- 3.9 kW of monofacial, fixed-tilt, Panasonic heterojunction with intrinsic thin layer (HIT) in Albuquerque, New Mexico over a 1-year period
- 3.3 kW of monofacial, fixed-tilt, Canadian Solar mono-crystalline silicon (mono-c-Si) in Albuquerque, New Mexico over a 1-year period
- 26.84 kW of monofacial, tracked, Trina mono-crystalline silicon passivated emitter and rear cell (PERC) in Roskilde, Denmark over a 1-year period
- 25.96 kW of bifacial, tracked, Trina mono-crystalline silicon PERC in Roskilde, Denmark over a 1-year period
- 26.84 kW of monofacial, fixed-tilt, Trina mono-crystalline silicon PERC in Roskilde, Denmark over a 1-year period
- 25.96 kW of bifacial, fixed-tilt, Trina mono-crystalline silicon PERC in Roskilde, Denmark over a 1-year period
**Additional details about the module and system specifications are included in the INSTRUCTIONS_PV_modeling_comparison.doc file
Reporting Results
In order to participate one must “copy and paste” their hourly estimates (i.e., POA irradiance, module temperature, DC power) into the corresponding tabs (S1 – S6) of the Results.xlsx excel file (see below) and email the file to mtheris@sandia.gov. Running all scenarios is optional, but strongly encouraged. In addition to the estimated hourly timeseries, the participants are requested to provide answers with respect to the model/software they used and inputs/assumptions according to the questionnaires at each excel tab.
Files
- Detailed Information and Instructions
- Weather Data
- Module Specifications and test reports
- S1: Panasonic VBHN325SA16
- IEC 61853-1 Module test report: Panasonic VBHN325SA 16 Module (277486 downloads )
- IEC 61853-1 Excel file: IEC-61853-1 Matrix Data for Nine PV Modules (157117 downloads ) , Please note that Canadian 275 and Panasonic matrix data are in the 19074-005 (CS6K-275M) and 19074-001 (VBHN325SA 16) excel tabs, respectively.
- IEC 61853-2 (IAM & NMOT) Module test report: IAM+NMOT Test Report - Panasonic VBHN325SA 16 (149850 downloads )
- PAN file: PAN File (Panasonic VBHN325SA 16) (138761 downloads )
- Spec sheet: Panasonic VBHN325SA16 (148756 downloads )
- S2: Canadian Solar CS6K-275M 275W
- IEC 61853-1 Module test report: Canadian Solar CS6K-275M Module (284083 downloads )
- IEC 61853-1 Excel file: IEC-61853-1 Matrix Data for Nine PV Modules (157117 downloads ) , Please note that Canadian 275 and Panasonic matrix data are in the 19074-005 (CS6K-275M) and 19074-001 (VBHN325SA 16) excel tabs, respectively.
- IEC 61853-2 (IAM & NMOT) Module test report: IAM+NMOT Test Report - Canadian Solar CS6K-275M (149702 downloads )
- PAN file: PAN File (Canadian Solar CS6K-275M) (139003 downloads )
- Spec sheet: Canadian Solar CS_CS6K-275M (149808 downloads )
- S3: Trina Allmax+ 305W
- Spec sheet: Trina Allmax+ 305W (152022 downloads )
- S4: Trina Duomax Twin 295W
- Spec sheet Trina Duomax Twin 295 (151757 downloads )
- S5: Trina Allmax+ 305W
- Spec sheet: Trina Allmax+ 305W (152022 downloads )
- S6: Trina Duomax Twin 295W
- Spec sheet: Trina Duomax Twin 295 (151757 downloads )
- S1: Panasonic VBHN325SA16
- Inverter Spec Sheets
- Albuquerque inverters: SMA Tripower 20000TL-US (148929 downloads )
- Roskilde inverters: Delta RPI M50A (151412 downloads )
- System Designs
- File to paste in your modeling results
- Results.xlsx (153830 downloads ) – Please download this file and add your modeling results and answers to the survey questions and email it to Dr. Marios Theristis at Sandia.
FAQs (updated 8/27/2021)
All questions will be answered here as they are received. Please check back for updates.
- Is this model comparison only on the DC side, or does it include inverter capacity?
- The blind modeling comparison is for DC power only.
- What soiling loss values should be assumed?
- Generally, both Albuquerque and Roskilde observe very low soiling rates. We would like to see how soiling assumptions vary among modelers, so we prefer not to give any values out. Therefore, you can assume any reasonable value of soiling that you think is more appropriate for these low soiling locations.
- Are the strings always maintained at MPP?
- Yes
- What is the actual DC: AC ratio to be assumed? For example, for Albuquerque: A 3.9kW DC array is connected to a 20kW inverter. This would lead to higher inverter losses than useful
- The 3.9 kW and 3.3 kW are single strings from separate systems which consist of 4 strings each. Each inverter has 2 inputs/MPPTs, therefore, 2 strings are placed on one MPPT input. The inverters were oversized to avoid any clipping. For example, the Panasonic system (15.6 kW for 4 strings) is connected to a 20.4 kW inverter (DC/AC ratio of 0.76) and the Canadian 275 system (13.2 kW for 4 strings) is connected to a 15.3 kW inverter (DC/AC ratio of 0.86). The Roskilde systems are connected to 50 kW inverters, which also have 2 MPPTs. Based on the frontside rating and rated inverter power, the DC/AC ratios in Roskilde are 1.04 (bifacial systems) and 1.07 (monofacial systems). However, the inverter has a max power input of 58 kW before clipping (see datasheet)
- Is the weather data for the year 2020?
- Yes, in Albuquerque. Roskilde is 2019-2020
- Why is the weather file missing Feb 29th?
- In order to avoid leap year effects, Feb 29th was removed. We also wanted to have a TMY compatible format with 8760 hours in a year.
- What is the commissioning date for each array? There seem to be older modules installed and without any assumptions on degradation especially on the TRINA and PANASONIC modules it might lead to a gap in results.
- The Canadian 275 system was commissioned in October 2017, whereas Panasonic was commissioned in June 2018. The systems in Roskilde were commissioned in August 2018.
- What LID assumptions can be made?
- The modules were exposed for 2-3 years prior to the year we shared. The modules with IEC 61853 data were also pre-conditioned according to the standard. The modelers can assume any LID values they feel are appropriate.
- Are the U0 and U1 coefficients in CFV report for NOCT equal to U_c and U_v in PV Syst/Plant Predict?
- No, these coefficients are for the Faiman model.
- Are more specific inverter files or datasheets available?
- Yes, inverter datasheets have been uploaded for Albuquerque and Roskilde sites (see Files section above).
- Can the IEC 61853 results be made available in xls format? Otherwise you’ll have typos distorting the results.
- The IEC 61853-1 matrix data are available in an excel file. It has been added above to the Files section.
- Could you provide weather in one or five-minute intervals?
- We are planning to include datasets of finer resolution in the next modeling comparison.
- Could you provide photographs of the systems?
- Photo of the Canadian Solar system in Albuquerque can be seen here. The Panasonic system is located on an identical rack in the same array field.
- What is the row spacing for the fixed tilt sites?
- The row spacing is 4.88 meters in Albuquerque and 7.6 meters in Roskilde. Row spacing is the distance between two identical positions in adjacent rows.
- Could you provide layout information for shading calculations?
- The modules are placed in a 2-up landscape configuration with a row spacing of 4.88 meters and 7.6 meters in Albuquerque and Roskilde, respectively.
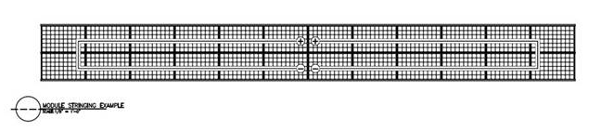
- Could you provide electrical layout for mismatch calculations?
- Yes, figure below shows the stringing configuration of the modules in the arrays in Albuquerque.
- Which of the data sources provided (spec sheet, matrix, PAN file) best represent the installed modules?
- We provided all the information we have available in this modeling comparison. Some of the objectives are to see if any data sources are more preferable than others and to investigate whether different data sources affect modeling accuracy or not. It is up to each modeler to decide which data source(s) is/are more appropriate. Modelers are welcome to send multiple results with different inputs given that they specify the differences in the questionnaires.
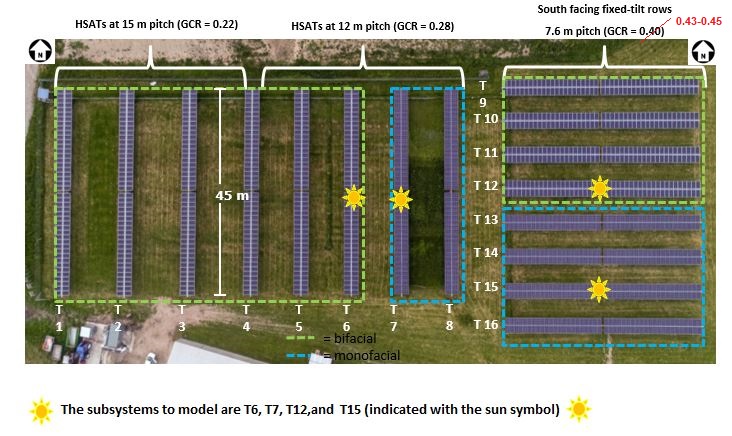
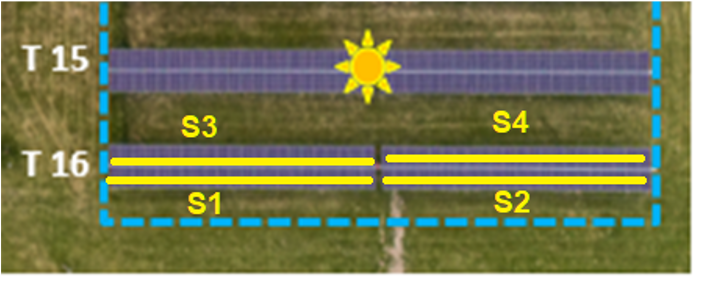
- Please can you provide string (electrical) layout for Roskilde systems (or is it the same pattern as in Albuquerque)?
- Each T6, T7, T12 and T15 subsystem from the Roskilde aerial photo consists of 4 strings of 22 modules. The 22 modules are connected in series in each string, and the 4 strings are in parallel. An example of the stringing configuration in Roskilde is shown below.
- Can you provide the coordinates of the weather station in Albuquerque?
- The location of the weather station: 35.0546°, -106.540105°.
- I wanted to ask if there will be .PAN files provided for the Trina modules for cases 3 through 6?
- Unfortunately, we do not have PAN files for the Trina modules but they might be available in the PVSyst database if you have access to it.
- Can you provide single line diagrams?
- Both Panasonic and Canadian Solar systems are connected in the same manner in Albuquerque, NM. Please note that only one string per system is modeled for the Albuquerque site (e.g., CM1 in the diagram below). The one-line for Albuquerque systems is here: ABQ 1-line diagram (154085 downloads ) . The one-line for Roskilde is here: Roskilde 1-line diagram (206969 downloads )
- Can you provide inverter OND files?
- Unfortunately, we do not have any OND files for the inverters, but they might be available in the PVSyst database if you have access to it.
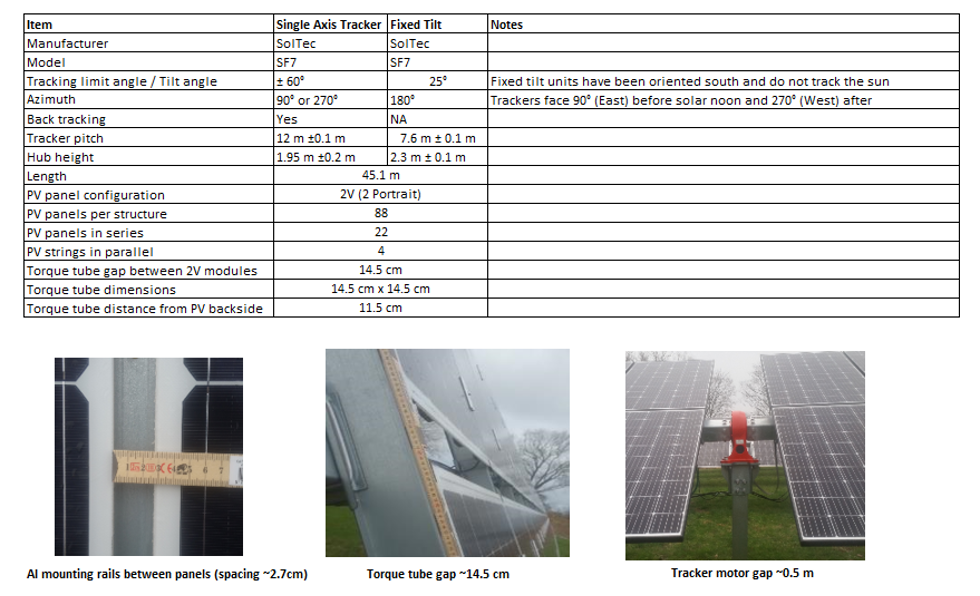
- Can you provide fixed racking and HAST design drawing: we would like to build system 3D model and determine accurate shading factor and mismatch loss by ray-tracing method.
- The following fixed racking and HSAT information are available for the Roskilde site which equips the bifacial modules.
- Are you asking for POA irradiance or effective POA irradiance?
- We are looking for POA irradiance. Your calculated POA irradiance values will be compared against pyranometer data.
- Albuquerque Figures:
- Roskilde Figures: