Datasets

1 year of 5-min measured spectra from Albuquerque, NM USA

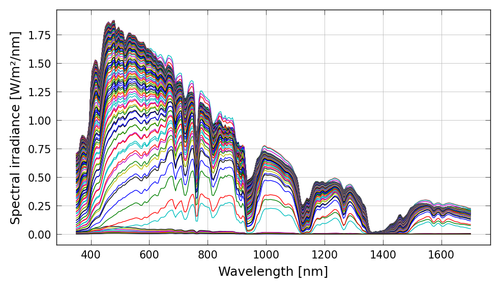
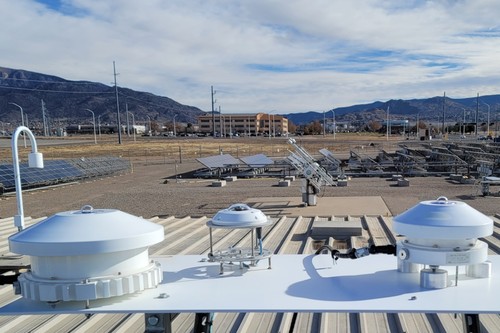
Sandia National Laboratories has measured global normal spectral irradiance nearly continuously from August 2013 to April 2018. During this time other broadband irradiance measurements (global horizontal, direct normal, diffuse horizontal and global normal) and weather variables were also recorded. For this dataset PV Performance Labs (PVPL) has pulled together data from both sources to assemble a full calendar year spectral dataset for use in photovoltaic research. It is composed of eight continuous segments of different durations taken from the two-year period September 2013 to August 2015.

IEC 61853-1 and -2 Reports and PAN files

Sandia National Laboratories had 12 different module types characterized according to IEC 61853-1 and 61853-2 standards at CFV Labs. This data was used by CFV to generate PAN files. We are sharing this data publicly so that PV engineers and performance modelers can use it to to develop better methods and models. Field performance data from these systems is available in other data packages.

IEC 61853-1 & IEC 61853-2 Dataset from: Climatic Rating of Photovoltaic Modules: Different Technologies for Various Operating Conditions (2020)

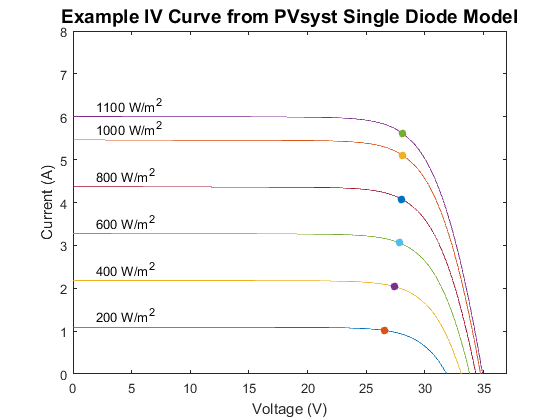
This dataset from SUPSI in Switzerland includes: (1) indoor module characteristic data (IV curves at irradiances between 100-1100 W/m^2), measured spectral response, measured angle of incidence response, thermal coefficients measured outdoors. (2) These modules were placed outdoors in Switzerland for one year during which IV curves were measured every five minutes.

Field data from Albuquerque, New Mexico USA

Sandia National Laboratories and PV Performance Labs are sharing a one-year dataset containing: irradiance, ambient temperature, wind speed and down-welling infrared radiation, as well as measured back-of-module temperature measurements from a fixed-tilt array of Panasonic HIT modules in the center of the PV field. The data also includes a python Jupyter notebook with examples of reading the data and fitting a basic model.

Weather and Module Characterization Data from Roskilde, Denmark and Albuquerque, NM

This dataset includes all files that were provided to participants of the 2021 PVPMC Blind PV Performance Modeling Comparison. The results of this exercise are published in Progress in Photovoltaics  https://doi.org/10.1002/pip.3729

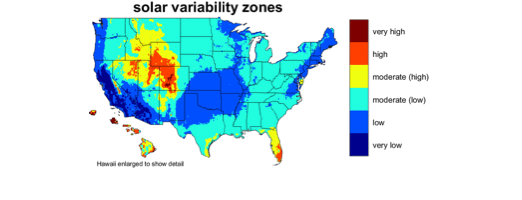
High frequency (1-sec) irradiance data from different regions around the USA

This data is described in: Matthew Lave, Robert J. Broderick, Matthew J. Reno, Solar variability zones: Satellite-derived zones that represent high-frequency ground variabilitySolar Energy, Volume 151, 15 July 2017, Pages 119-128, ISSN 0038-092X. Data samples are available for download.

1 year of 5-min measured spectra from Albuquerque, NM USA

Sandia National Laboratories has measured global horizontal spectral irradiance nearly continuously from September 2019 to March 2022. During this time other broadband irradiance measurements (global horizontal, direct normal, diffuse horizontal and global normal) and weather variables were also recorded. For this dataset PV Performance Labs (PVPL) has pulled together data from both sources to assemble a full calendar year spectral dataset for use in photovoltaic research. It is composed of 12 continuous segments of 15-days each, beginning with Jan 1-15 and ending with Dec 1-15. The segments are from Oct 2019 to Sept 2021.

Geographic raster datasets from climatic PV performance studies

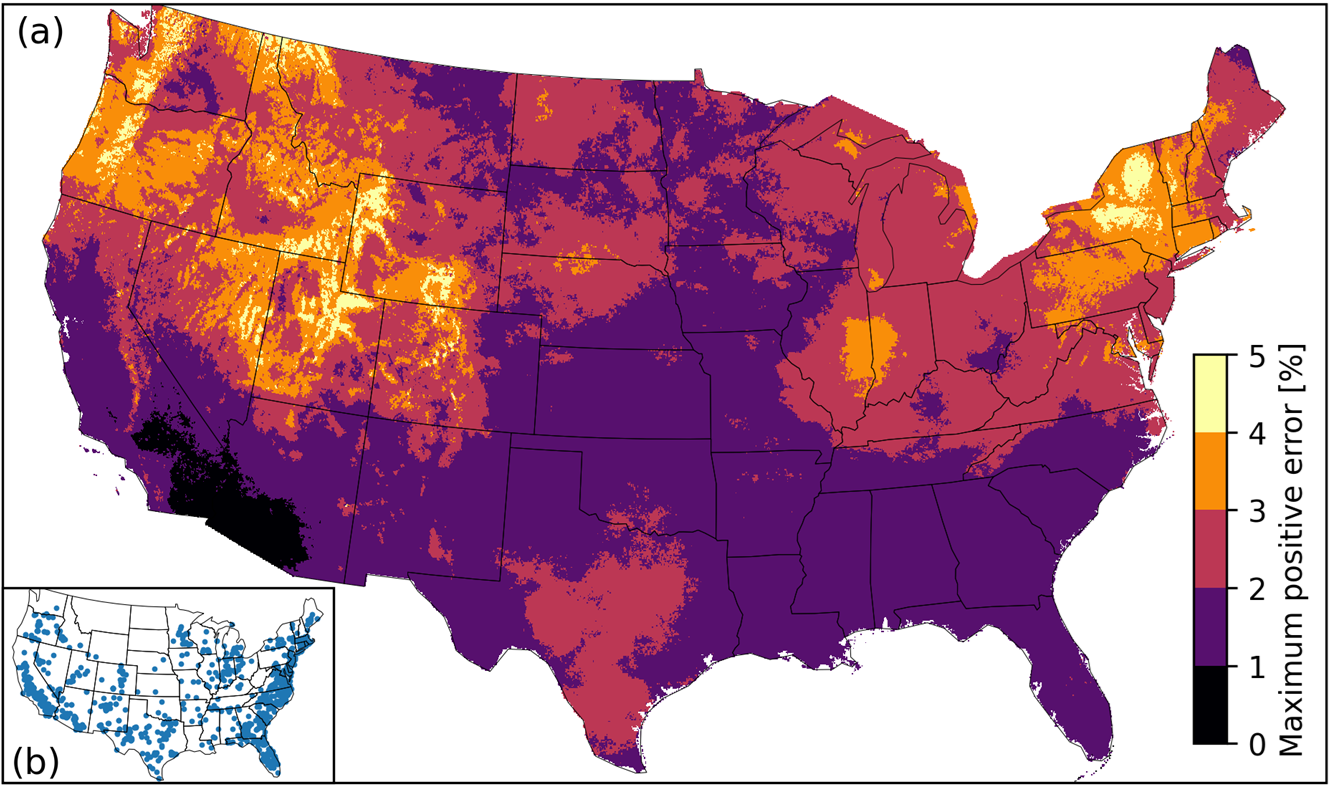
Sandia National Laboratories is investigating how climate affects PV performance modeling and analysis. The interaction of location with PV system configuration, choice of model, and KPI uncertainty is evaluated across climates at up to 4-km resolution using NSRDB data, pvlib-python, and high-performance computing clusters. Geographic raster data summarizing the simulation results are available in GeoTIFF format.